Review of Analytical brief on EU organic imports in 2025.
By Bo Elzakker
Last June the EU Commission published its analysis and some statistics of EU imports of organic products in the previous year. To download: https://agriculture.ec.europa.eu/cap-my-country/performance-agricultural-policy/analytical-briefs_en, click the second publication: Analytical Brief N.16: EU imports of organic agri-food products – Key developments in 2025. It is an 18-page narrative report, quite readable, presenting the figures for 2024 and 2025 with some interpretation and analysis. There is also Analytical Brief No.16: EU imports of agri-food products – Data. That is the underlying data in MS Excel, so the interested reader can look at the data from 2018 onwards. Please note that the brief is mainly volume based, metric tonnes. Only graph 2 is about value, euros. It is not only food, e.g. the wheat and soy is also used as feed.
The Organic Observatory (OO)¹ has done some analyses from an integrity point of view. The recent ‘Have your Say’ consultation on the EU’s List of High-Risk products indicates that listing is mainly based on residue findings at import. We believe that an analysis of trade data may also provide some questions regarding the integrity of some commodities linked with certain origins. In earlier fraud cases we saw that large annually fluctuating (almost surprising) volumes at cheap prices upset import markets both in the EU and US.
The current draft EU High-Risk Country Commodity list mentions China, Ecuador, Peru, Togo, and Türkiye as origins of nine Hi-Risk commodities. They are all in the top 10 countries exporting to the EU. The OO concentrated on the products in which it has some expertise based on earlier Country-Commodity Studies.
Total exports of a country
When reading the analytical brief, one sees steep increases in imports between 2024 to 2025 from countries like Kazakhstan (No 22 imports, +172% increase), Togo (No 8, +47.3%) and Uzbekistan (No 62, +96.5%) but also Mali (No 54, +83.2%) and Chad (No 56, +48.3%). We note the relatively reasonable percentage increase (+11%) in bananas from Ecuador – the No1 EU import, it is on the EU High-Risk list.
Steep increases can be explained in different ways. Are these exceptions or were trade volumes fluctuating strongly also in other years? What are these products, are they annual crops or perennials? We presume it is commodities, raw materials, not processed foods. Is it good or bad weather? With the great increases, is it retroactive conversion, with previous decreases because of operator withdrawal or decertification? Is it marketing only when there is a good price, or did it go to the US instead? Is it late marketing, the export not in November and December but in January and February, or the other way around the previous year? Or were there transport issues like border and port closures? Were there strong fluctuations in market prices, shortages resulting in release of old stocks? What do the CB inspection reports say when the organic farm plan, the rotation, is reviewed, when actual yields are compared with yield estimates, when the auditors do mass balancing or volume reconciliation?
Kazakhstan exports mainly wheat, relatively little soy. For Togo it is soy (on the EU High-Risk list). Uzbekistan should be wheat. Mali is mainly a sesame exporter but also fresh and dried mango and chad oilseeds. The table gives imports into the EU over the years in 1000mt and percentage increase or decrease from one year to the next.
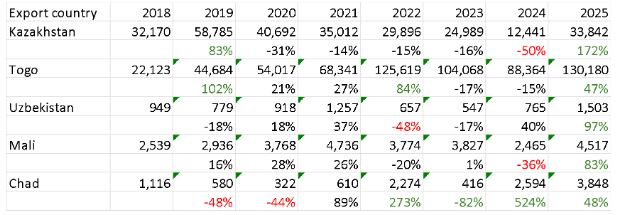
All countries show some strong ups and downs in their exports to the EU. In this group Mali looks like the most stable one. We expect that the EU is its main market and that there are only a few CBs involved. The changes are likely due to weather conditions, some suspension, decertification, some expansion again. In 2024 its exports went down abruptly and in 2025 it is an all-time record. We hope -and expect- these numbers are backed up by records of mass-balancing in the inspection reports.
Kazakhstan is a much bigger country. It has, in the past, been supplying volumes like those exported to the EU in 2025. 2024 is exceptionally low, 2025 is picking up to the levels of earlier times. Canada and the US are important other off-takers. Togo soy is an interesting case, see later. Uzbekistan is a relatively small organic exporter, exporting more to the US and China than the EU. As with Kazakhstan, the wheat is transported over long distances by rail and ship, and still selling at competitive prices when imported. One can wonder about the use (if any) of approved organic inputs, and hope that it is documented in inspection reports.
Mali appears to be a small but fairly stable exporter; the weather and political upheaval are main disturbing factors. Chad is more of a newcomer with significant increases in 2022 (+273%) and 2024 (+524%) so the 2025 increase of 48% is rather modest. When it is oilseeds like soy it might be worth noting, but it is a very small supplier.
Oilseeds and protein crops
One can wonder where the steep increase in the imports of oilseeds and protein crops (+20.5%) including a 39.4% increase in soy cake comes from. That is mainly from China (226K Mt, 43% of supply, a 39.6% increase) and Togo (158K Mt, 24% of supply, a 49.9% increase) and to a smaller extent from Moldova, India, Serbia, and Brazil, respectively 4.8, 3,0, 2.0 and 1.3% of imports. The impact of weak integrity is much larger from the big suppliers. The spreadsheet provided does not give a breakdown in commodities. A deeper dive into TRACES might reveal big fluctuations.
China is a big conventional soy importer as it is not producing enough soy for its domestic consumption. However, it is exporting organic soy to Europe and the US. What does that say about price levels? There are concerns regarding the integrity of different organic Chinese grains, including soy, among some EU and US importers. Also from farmers who find it difficult to believe that it can be that cheap – in the case of the US, pushing American organic farmers out of the market. A coming issue of TOS will review a recent Chinese report on its soy situation. A case study of China soy and other grains by the Organic Observatory is in preparation, you will be able to read more about it on a future TOS issue.
Togo started producing organic soybeans as an animal feed ingredient originally for the French market, then to the EU market but in the last years also to the US. Like China, Togo prefers to export organic soybean cake with the oil consumed domestically, to substitute EU subsidised imports of French sunflower oil for cooking. Recently, Togo² announced that it plans to export 300,000 tons of organic soy in the 2026-27 season while it sees 700,000 as the organic market potential, in the EU and US together. Togo soy is under scrutiny from various organisations and so are other organic soy exporting countries.
Coffee and cocoa
Questions can be asked regarding the steep increase (+25,5%) of imports in the category of coffee, tea, cocoa, and spices from 2024 to 2025. With products from the Dominican Republic (+81,9%), Honduras (+42,1%) or Uganda (+40.9%). The Dominican Republic’s main product is cocoa. For Honduras it can be both coffee and cocoa, and for Uganda, it is mainly coffee and some cocoa.
As far as we can learn from the statistics, all three countries have been producing such quantities before, so it could be recovery from bad crops, decreasing volumes in earlier years. Both coffee and cocoa saw important price increases in 2024 (for all producer countries) but can that influence volumes that fast? The price increase came from lower yields of coffee and cocoa because of climate change (Brazil, Vietnam, West Africa). It could be that the three countries with increasing exports were not particularly hit, or even benefitted from climate change but, with such a big change in one year? It is difficult to believe that these countries are shifting exports away from North America to Europe, it should rather be the other way around. One has to look at US organic imports but we did not have recent GATS statistics at hand.
Unfortunately, the latest FIBL-IFOAM World of Organic Agriculture publication³ contains data up to 2024 so it was of limited value for this review. And note, those statistics relate mainly to certified acreage, not to exports, volumes or value.
Smaller exporters
There is very little said in the EU Brief about the smallest exporters. The OO saw two countries with exceptionally high growth.
Venezuela, moving from exporting 2 tons in 2024 to 355 tons in 2025, has a record 23,572% increase. Its first time export to the EU was in 2023 with 25 tons. It is unfortunate that one can not see in the brief or the excel what product(s) it is. Google Search Assistant says it is fine flavour cocoa. 355 tons is a substantial amount. It would be interesting to know how conversion, certification and export was done.
The second biggest relative increase is from Zambia (+996.7%), from 23 tons (1 container?) to 250 tons (10-11 containers). Probably all honey? See the statistics. What happened there? Its exports to the EU are rather haphazard. Honey production may be fluctuating but not that much. The increase in tonnage to 250 tons in 2025 is surprising even when we know that the country has a lot of certified honey, having met an exporter during the 2025 Biofach show – which is somehow reassuring.

Visibility, validation
A lot of the data presented needs some more clarification. We can not expect all exporting countries to be present at trade shows. A good alternative is that countries, their organic activities, their products,and their producers are visible on the internet. Some governments or agencies like export promotion boards already publish reports on organic production, the domestic and the export market that can be used for confirmation, and triangulation. A willingness to share information can only help to improve integrity.
Conclusions
We have found it a worthwhile exercise to consider this report. Only in a few cases could we raise a yellow or orange flag. We need to have more information and to understand sudden changes in international trade in organic products better.
Although from quite a different angle, their track record, their ambition, Togo soybeans and soy cake confirms the EU High-Risk listing.
Questions to readers
We did not have the time to balance, compare the EU report with similar information from USDA’s Foreign Agricultural Service’s Global Agricultural Trade System GATS. That raises the question: would someone from North America be willing to help the Organic Observatory with that kind of analysis?
Is the EU Commission itself using TRACES for integrity checks? Signalling unusual activity within the year and over the years? Are the Commission or Competent Authorities doing any background checking, looking into CB inspection reports for clarification?
We know that some traders, organic trade associations, and farmer associations are concerned about cheap, surprise, and in some cases “not so organic” imports that are upsetting markets. Would they be willing to collaborate in a future Organic Observatory analysis? Or case studies?
¹The Organic Observatory is The Alliance for Organic Integrity’s project to “Study and Address Fraud” in organic supply chains.
³https://www.fibl.org/en/shop-en/1747-organic-world-2024
For comments, ideas, collaboration, please email elzakker@alliancefororganicintegrity.bio